CHM3120L
Introduction to Analytical Chemistry: Laboratory
| Lab Schedule |
| LON-CAPA Pre-Labs |
| Resources |
| Contact Instructor |
| Chemistry Home Page |
![]()
Quantitative Analysis of Hydrocarbons by Gas Chromatography: Procedure
Samples.
Obtain a set of samples and a syringe from your TA. You should have small bottles containing pentane, an equal volume mixture of pentane, hexane, heptane and octane, and an unknown.
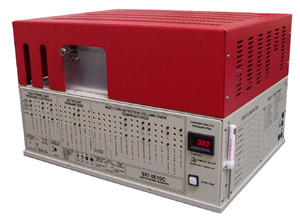
Instrument Familiarization.
The gas chromatograph uses a packed column of polydimethyl siloxane and a thermal conductivity detector with helium as the mobile phase. A simple soap-bubble flowmeter attached to the column outlet allows measurement of the gas flow rate. A computer using a software package called PeakSimple operates the gas chromatograph that will be used in this lab. This software not only controls the GC but also can be used to treat data.
The detector can be destroyed if it is turned on without an adequate flow of helium through the system. Your Teaching Assistant will turn on the system and adjust the gas flow. The carrier gas pressure and the detector operating conditions will have been set to appropriate values. Do not adjust these.
Note the controls and indicators on the front panel of the chromatograph. LEDs on the status panel show when a component is active or being thermostatically controlled. Locate the LEDs for the thermal conductivity detector (TCD) and the column. The display selector switch toggles between constant display of the column oven temperature (down position) and display of parameters selected by the push buttons below the LEDs on the status panel. The selected quantity is displayed on the three digit LED display.
Using the Chromatograph:
- Put the switch in the up position and note the temperature of the TCD.
- If the PeakSimple program for your chromatograph is not already running, start it in the usual fashion by double clicking on the appropriate icon (GC1, GC2, GC3 or GC4).
- When the program completes its initialization, right-click in the chromatogram display zone.
- Choose “Temperature” on the menu that appears.
- Highlight the existing temperature program and click on the “Change” button. For the initial measurements you will want to run at a constant temperature of 60° C.
- Set the program for “60° C for 20 minutes then ramp at 0° C/minute to 60° C.”
- Exit the menu.
- Note that the column temperature changes. After the column temperature stabilizes record the column temperature and the TCD temperature.
- Use a stopwatch and the soap bubble flowmeter to measure and record the flow rate (mL/min) of the mobile phase.
- By gently squeezing the rubber bulb raise the level of the soap above the side arm so that a soap bubble rises up the pipet column.
- Use a stop watch to record the time required for the bubble to sweep through a measured volume and calculate the flow rate.
Note: If the pipet is dry when you start the bubbles may collapse before they reach the top. You may need to start several bubbles to wet the column. You can refill the bulb by adding soap to the top of the pipet.
Injecting Samples.
When using direct injection, as we will here, the technique used to prepare the syringe and perform the injection can affect the quality of the separation and the reproducibility of the results. Take care not to bend the needle when inserting it into the injection port. Syringes are expensive!
Develop a consistent technique of injection using the following steps.
- Prime the syringe. Draw in sample. Eject the sample outside the vial. Wipe the needle. Repeat several times.
- Draw one microliter of air into the syringe.
- Draw one microliter of sample into the syringe after the slug of air.
- Draw another microliter of air into the syringe, sandwiching the sample between the slugs of air as shown below. Wipe the needle.
- Smoothly and quickly insert the needle its full depth into the injection port, press the plunger, withdraw the needle, and tap the space bar on the computer keyboard to start the data collection.
Measurements.
- Tap the space bar to start data acquisition.
- Click on the “Z” button to zero the display. You can adjust the position of the zero line on the display by clicking and dragging it.
- Terminate the run by tapping the “End” key. Display limits can be adjusted by clicking the “+” and “-” buttons. You should start with a range of about 100 mV. You can also set the default limits for the display through the Edit menu.
- Click Edit/Channels/Details and enter numbers for the maximum and minimun default display limits.
Isothermal measurements
- Set the chromatograph for isothermal measurements at a column temperature of 60º C.
- Inject 1 mL of pentane. The pentane peak should appear in about 2 minutes. Once the pentane peak has returned to the baseline you can terminate the run. By adjusting the scaling (clicking on the “+” button) you should also be able to see a weak air peak that occurs a little before the pentane peak.
- Right click on the pentane peak. A menu will appear. Select “add component.” A retention time and range bar will appear. Right click on the peak again and select “edit component.” Enter the name of the component (pentane) in the appropriate space.
- Click on the “Results” tab. Record the retention time and peak area. Close the window.
- Repeat injecting and recording pentane chromatograms until you have five sequential measurements with a range of less than 0.1 minutes in the retention time. The peak areas should have a range of about 20% of the peak area.
- Determine retention times for air and the normal hydrocarbons (pentane, hexane, heptane, octane) using 1 mL injections of the four-component mixture. Run and record values at least three times. Save these chromatograms as both binary (CHR) and Ascii (ASC) files, with the names nnn4ISOx, where nnn is your initials and x is a run number. Are all the peaks resolved? Air is a nonretained component. You need to know the time at which it appears to be able to calculate adjusted retention times for the sample components. If you have trouble seeing the air peak try injecting only air (up to 5 mL) and running a chromatogram. You do not need to save any air-only chromatograms, but record the air retention times. To enable the software to detect the air peak and display its retention time you may need to adjust the integration parameters. Click on Edit/Channels/Integration and set “Area reject” to a small value (1 or 2).
Temperature programmed measurements
- Set the chromatogram to run at 50º C for 1 min and then to ramp up at 20º per minute for 6 minutes. (Right click in display space and select “Temperature.”)
- Since you have changed the conditions the component markers are no longer relevant. To clear them select Edit/Channels/Components/Clear.
- Record a chromatogram for your four-component mixture. Label the components. Are all the peaks resolved? Record the retention times and peak areas for the components. Save CHR and ASC files. Label them with the name nnn4PGMx.
- Record and save CHR and ASC chromatograms for your unknown. Label them nnnUNKx. Record the areas for all the components.