
CHM3120L
Introduction to Analytical Chemistry: Laboratory
| Lab Schedule |
| LON-CAPA Pre-Labs |
| Resources |
| Contact Instructor |
|
![]()
Potentiometric Titration of an Acid Mixture : Report Template
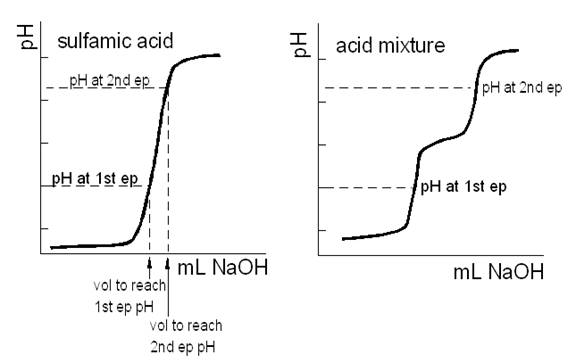
Using Excel, plot the data for each titration (pH vs. volume of base added). The sulfamic acid (standardization) titrations will have one end point, the unknown mixture two. Sodium carbonate present in the NaOH titrant causes the molarity of the solution to vary as a function of the strength of the acid. The best way to correct for the carbonate error is to obtain two effective NaOH molarities from the standardization curves. This process is illustrated in the figure below.
On the mixture titration curve find the pH at each end point. For purposes of illustration assume one is at pH 5 and the other at pH 10. On the sulfamic acid titration curve find the volumes of NaOH required to titrate to pH = 5 and to pH = 10. Use the first volume and the mmol of sulfamic acid used to find the effective molarity of the NaOH in titrating the strong acid and the second volume and the same mmol of sulfamic acid used to find the effective molarity of the NaOH in titrating the weak acid. Thus, the NaOH titrant will have a 'strong acid' molarity, Ms, and a 'weak acid' molarity, Mw. If there is no carbonate error, the pH vs. volume curves will be essentially vertical in the region of these end points, and Ms and Mw will be indistinguishable.
The end points for the unknown acid titration correspond to the inflection points in the pH vs. volume curves. However, these points are more accurately determined by a derivative plot; d(pH)/d(vol) vs. volume. The end points correspond to the tops of the peaks that will be apparent.
The following is a sample calculation using real data. Using Excel, plot the data for the first sulfamic acid titration (pH vs. volume of base added). For example:

Plot the data for the first unknown acid mixture titration.

Calculate and plot the derivative of the unknown acid titration curve to determine the equivalence points1.

Use the mixture titration data to find the pH at each equivalence point. The first equivalence pH lies between a pH of 4.35 & 4.69. For this example, an average pH of 4.52 will be used. The second equivalence lies between a pH of 9.08 & 9.39 for a compromise pH of 9.24. These two pHs are the numbers used to find the milliliters of NaOH needed to titrate the sulfamic and any carbonic acid that may be present.

Turning to the sulfamic acid data, a pH of 4.52 correlates with a sodium hydroxide volume close to 29.03 mL and a pH of 9.24 correlates with a sodium hydroxide volume of 29.22 mL. Both of the previous numbers are arrived at by a simple linear interpolation between data points, which may or may not be a good approximation.

The 29.03 mL & 29.22 mL volumes of NaOH are effective volumes; they account for both the titration of the sample acid and the presence of carbonic acid at the selected pH values. For your data, use the first equivalence volume (29.03 mL in sample data) and the exactly known sulfamic acid concentration to find Ms, the “strong acid” molarity of NaOH. Use the second equivalence for the determination of the “weak acid” molarity of NaOH, Mw.
When generating the abscissa, V has the following form: . ![]()
On the other hand, when calculating ![]() the
the ![]() V is simply the difference
V is simply the difference ![]() .
.
Now use Ms molarity of NaOH and your data from the unknown acid titration to calculate the molarity of the strong acid. Likewise, use Mw to calculate the molarity of the weak acid. Do not forget the assumption that the weak acid’s titration starts only after all strong acid has reacted with NaOH.
Repeat the above calculation for each pair of sulfamic and unknown acid titrations.
REPORT
For sulfamic acid and your unknown report one titration curve plot and one derivative plot.
In tabular form, report Ms and Mw and the average and standard deviation for each for the replicate titrations of your NaOH solution. Report the mmoles of strong acid and weak acid in your mixture for at least three determinations. Report the average and standard deviation for your determinations.