|
Experiment 3 Atomic SpectraPrint this pageProcedure | ||
CHEMISTRY HOME
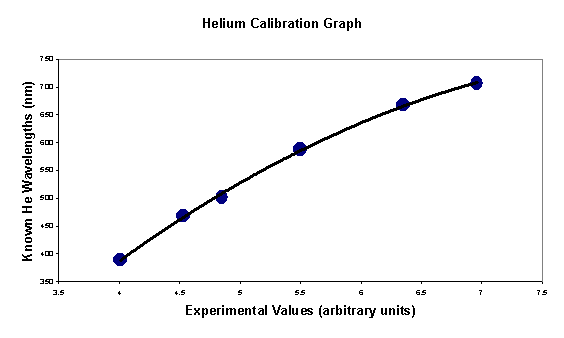
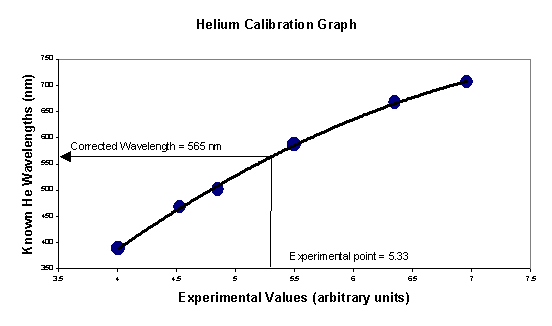
| What you need to do: Warning: Do not get too close to either the flame or lamp light sources since they may cause burns. Also, be careful around the flame sources as the set-ups contain concentrated hydrochloric acid. A. Spectroscope Calibration 1) Obtain a spectroscope from the front counter. 2) Obtain a ring stand from under the front counter. Set the ring stand up in front of the helium lamp using your lab notebook to space the ring stand from the lamp. (i.e., the legs of the ring stand should be exactly 1 notebook length away from the lamp) 3) Set your spectroscope up on the ring stand. Focus the spectroscope so that light from the helium lamp comes in directly through the vertical slit. Look through the eyepiece where the grating is located and find the bright visible lines on the scale to the right of the slit. Read the scale accurately. You should be able to read the numbers and marks, as well as estimate between the marks, so each number you record should have three significant figures. Make sure that you do not move the spectroscope once you have aligned it with the light source. Have your partner record your readings. Now let your partner read the spectroscope while you record. He/she should read the spectroscope in the exact same alignment that you did. Check to see if your readings agree. You may decide that several attempts are in order to get the most reliable readings. 4) Using the graph paper in your report worksheet, create a graph of the known wavelengths of helium versus the wavelengths of the same colors you just observed experimentally. 5) Make a best-fit line to your data. Example: B. Identifying the Unknowns 1) Use the spectroscope that you have just calibrated. 2) Set up your spectroscope in front of one of the unknown light sources. Record all the colors and wavelengths of each line you observe. 3) On your calibration graph, on the x-axis find the value of the first of your observed lines. Now using a vertically aligned straight line find the point on your best-fit line that corresponds to that value. Now find the point on the y-axis that also corresponds to that point on the line and record that value in your notebook. 4) Repeat steps 1 - 3 for all of the observed lines for all of the unknowns. Example:
|
|
|
|
|
|
||
|